Some investors are leaving—or trimming—their fixed-income allocation to reach for higher returns in dividend-paying equities. Bonds promise principal at maturity and timely interest. Common stocks do not. Equities carry market risk and respond to earnings, sector dynamics, and geopolitical shocks. Bonds are also volatile, but interest rates largely drive their volatility, and they are generally lower than that of stocks.
What’s changed in 2026 is the math. Money market yields are coming down as the Fed cuts the cycle. The dollar suffered its biggest first-half loss in 50 years in 2025 and is expected to remain weak through the first half of 2026. Bond duration is risky in a regime of tariff and policy uncertainty. For investors who built up cash positions in 2023 and 2024 to capture short rates, the case for sitting still is weakening.

That doesn’t mean equity dividend ETFs are the right move for everyone. It means the trade-off has to be evaluated honestly: a higher current yield in exchange for equity drawdown risk, sector concentration, and—in some funds—distributions that are partly funded by return of capital, which quietly erodes the principal that produces the yield.
Three numbers matter when reading the menu: the yield (what you’ll be paid), the expense ratio (what you’ll pay to hold it), and the sector concentration (where the risk lives). A high-yield ETF that costs 0.58% per year and is concentrated in mortgage REITs is a different product from a 0.07% ETF holding the broad S&P 500’s high-dividend names. Both are sold under the same general “high-dividend ETF” heading.

U.S. Investments
For income investors who want simple S&P 500 exposure with a yield bias, the SPDR Portfolio S&P 500 High Dividend ETF (NYSEARCA: SPYD) is the cleanest baseline. SPYD holds the 80 highest-dividend-paying securities in the S&P 500. Its 30-Day SEC Yield is 4.36%, and its expense ratio is 0.07%—among the lowest in the dividend-ETF category. The portfolio is sector-balanced: Real Estate 21.59%, Financials 17.00%, Consumer Staples 16.14%, Utilities 13.48%. The fund is up roughly 6% year-to-date in 2026, with its value-oriented, real-estate- and energy-heavy mix outperforming the technology-heavy broader S&P. (Google Finance SPYD)
SPYD’s stylistic cousin is the Invesco S&P 500 High Dividend Low Volatility ETF (NYSEARCA: SPHD), which selects the 50 highest-yielding, lowest-volatility names from the S&P 500. SPHD’s 30-Day SEC Yield is 4.67,% and its expense ratio is 0.30%. The fund deliberately accepts less yield in some periods than less-screened peers in exchange for materially lower portfolio volatility, and its low-volatility filter helps avoid “dividend traps”—stocks where a high yield signals financial stress rather than strength.
Whether SPHD’s added cost is worth it depends in part on the empirical case for low-volatility investing. In a published whitepaper, AllianceBernstein argues that “Contrary to conventional wisdom, research shows that less volatile stocks tend to beat the market over the long term, in part by losing less in downturns.” The firm’s view is that momentum-style names—those that have risen sharply and tend to keep rising—soar more in bull markets but crash more in bear periods, leaving investors with more ground to recover. The academic literature on factor investing is more contested; momentum has been one of the most persistent factors documented in studies going back decades. Treat AllianceBernstein’s framing as one firm’s reading, not a settled fact. (AllianceBernstein whitepaper)
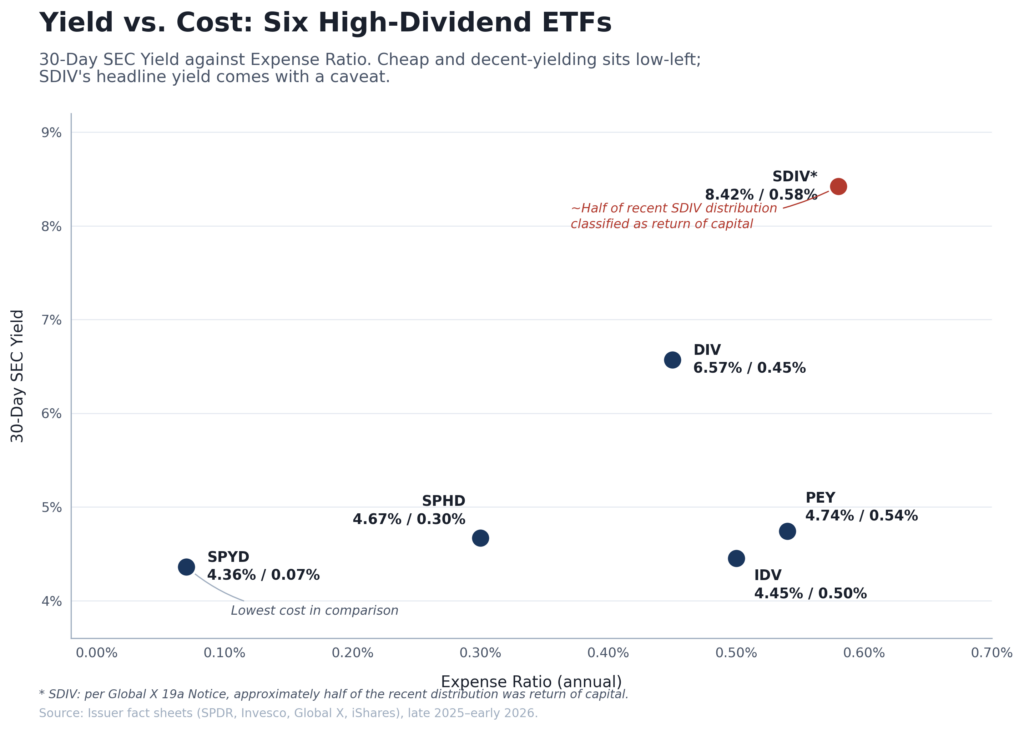
For investors who want dividend growth rather than peak yield, the Invesco High Yield Equity Dividend Achievers ETF (NASDAQ: PEY) tracks the NASDAQ US Dividend Achievers 50 Index, which holds U.S. companies that have increased their annual dividends for at least ten consecutive years. PEY’s 30-Day SEC Yield is 4.74%, and its expense ratio is 0.54%—the highest among the U.S. funds in this comparison. About 71% of PEY’s holdings are in four sectors: Financials, Utilities, Consumer Staples, and Industrials. The fund holds securities across all market-cap segments with a mid-cap tilt, and Morningstar projects earnings to improve from a historical −7.74% to a long-term +7.08%. (Invesco PEY)
Higher up the yield curve sits the Global X SuperDividend U.S. ETF (NYSEARCA: DIV). DIV’s 30-Day SEC Yield is 6.57%, and its expense ratio is 0.45%. The fund holds 50 high-dividend U.S. equities and screens for low beta to the S&P 500. The yield is real, but the risk is concentrated. Almost 40% of the assets are in real estate and energy. Energy is around 20% of the portfolio, currently supported by elevated oil prices tied to the situation in Iran, which can drive capital appreciation but also adds geopolitical risk to the position. (Global X DIV)
The real estate exposure is mostly in REITs, which are sensitive to interest rates: when rates rise, REIT borrowing costs go up, profits compress, and dividends can be cut. REITs also lease to office, retail, and other economically sensitive tenants whose payment reliability depends on the cycle. DIV also holds Master Limited Partnerships, primarily in oil and gas, which adds commodity-price volatility. And the fund is tilted toward small caps, which historically carry more risk than large caps.
DIV pays. But the 6.57% yield comes from concentration in two volatile sectors and a small-cap tilt. The investor has to decide whether that risk profile fits.
Global Investments
Many investors want international exposure as a hedge against further weakness in the U.S. dollar. Morgan Stanley Research has documented that the U.S. dollar fell about 11% in the first half of 2025, the biggest decline in more than 50 years, ending a 15-year bull cycle. Morgan Stanley’s most recent outlook expects further weakness through the first half of 2026, followed by a recovery in the second half of the year. (Morgan Stanley, Aug 2025; Morgan Stanley, 2026 outlook)
Other forecasts are more bullish. Zain Vawda at MarketPulse argues that 2026 will be a V-shaped year for the greenback, with weakness in the first six months giving way to a rebound by year-end. And Reuters reports that Dan Tobon, head of G10 FX strategy at Citi in New York, said, “We are dollar bulls in a world of dollar bears right now.” Tobon expects the dollar to strengthen at least through the third quarter of 2026, mostly against the euro, Canadian dollar, and sterling. The currency view isn’t settled—and that itself is a reason to consider non-U.S. exposure as a hedge rather than as a directional bet. (MarketPulse; Reuters, Feb 17, 2026)

The case for that hedge is now backed by a year of returns. For developed-market dividend exposure, the iShares International Select Dividend ETF (NYSEARCA: IDV) returned 51.69% in calendar year 2025—a figure driven in part by gains in non-U.S. equities and in part by the dollar’s decline, which translates favorably for U.S. investors holding foreign-currency-denominated assets. IDV tracks the Dow Jones EPAC Select Dividend Index, which holds the 100 highest-dividend-paying stocks across Europe, Pacific, Asia, and Canada. Its 30-Day SEC Yield is 4.45%, and its expense ratio is 0.50%. The fund’s largest country weights are in the United Kingdom (20.17%), Italy (11.10%), France (8.75%), and Spain (8.52%). Sector weights skew defensive: Financials 32.08%, Utilities 14.45%, Consumer Discretionary 10.03%, Communications 9.61%. Earnings have been weak historically, but Morningstar projects them to recover from −6.05% to a long-term annual rate of 5.87%. (iShares IDV fact sheet, 12/31/2025)
For more aggressive global income exposure, there is the Global X SuperDividend ETF (NYSEARCA: SDIV), which tracks an equally weighted index of the 100 highest-yielding stocks worldwide. SDIV’s 30-Day SEC Yield is 8.42%, the highest of any fund in this comparison. The expense ratio is 0.58%, the highest. The fund has paid monthly distributions for 14 consecutive years, with significant exposure to emerging markets: the United States 30.04%, Brazil 13.60%, Britain 10.23%, Hong Kong 9.50%. Sector weights are concentrated in higher-yielding categories: Mortgage REITs 18.67%, Energy 16.47%, Financials 15.79%, REITs 12.80%. (Global X SDIV)
The 8.42% headline yield deserves a closer look. Per Global X’s own SDIV fact sheet, approximately half of the fund’s recent distribution was classified as return of capital—meaning roughly half of what the fund pays out is the investor’s own principal coming back, not earnings. The remainder is genuine dividend income. That distinction matters for after-tax outcomes and, more importantly, for the durability of the headline yield. SDIV’s share price has eroded over time as a result, and longer-term total return has lagged the yield by a meaningful margin. Morningstar places SDIV in the small-cap value style box and projects long-term earnings growth of 5.07%, up from a historical rate of 12.37%. A substantial improvement if it materializes.
Comparison
All figures sourced from issuer fact sheets and SEC filings as of late 2025 / early 2026 unless otherwise noted. Confirm against current fact sheets before publication.
| Fund (Symbol) | 30-Day SEC Yield | Expense Ratio | Top Concentration | Key Risk |
| SPDR Portfolio S&P 500 High Dividend (SPYD) | 4.36% | 0.07% | S&P 500 high-div, balanced sectors (RE 22%, Fin 17%, Staples 16%) | Standard equity drawdown risk |
| Invesco S&P 500 High Div Low Vol (SPHD) | 4.67% | 0.30% | 50 highest-yield, lowest-vol stocks in S&P 500 | Low-vol tilt may underperform in strong bull markets |
| Invesco High Yield Equity Dividend Achievers (PEY) | 4.74% | 0.54% | Constituents must have 10+ years of dividend increases; ~71% in Financials, Utilities, Staples, Industrials | Highest fees in the comparison; mid-cap bias |
| Global X SuperDividend U.S. (DIV) | 6.57% | 0.45% | ~40% in real estate + energy; small-cap tilt; MLPs | Sector concentration, rate-sensitive REITs, commodity exposure |
| iShares International Select Dividend (IDV) | 4.45% | 0.50% | EPAC dev. markets: UK 20%, Italy 11%, France 9%, Spain 9% | Currency risk; country and sector concentration |
| Global X SuperDividend (SDIV) | 8.42% | 0.58% | Global high-yield: mREITs 19%, Energy 16%, EM exposure | ~Half of recent distribution is return of capital; share-price erosion |
The Verdict
The honest answer for most income investors in 2026 is that the choice between SPYD and SPHD is the cleanest decision in this comparison. Both are large-cap S&P 500-derived strategies. SPYD costs 0.07%, yields 4.36%, and gives broad sector exposure. SPHD costs 0.30%, yields 4.67%, and gives a low-volatility tilt that may or may not pay off depending on the regime. For a buy-and-hold income investor, SPYD’s expense advantage compounds favorably over time. For an investor worried about a near-term drawdown, SPHD’s tilt is defensible.

PEY occupies a different niche: dividend growth rather than peak yield, achieved by holding companies with at least a decade of consecutive dividend increases. The 0.54% expense ratio compounds over time for the investor. Worth considering for investors who specifically want the dividend-growth angle and the discipline that index methodology imposes.
DIV’s 6.57% yield is not free. It’s compensation for sector concentration in real estate and energy, and for exposure to small caps and MLPs. Investors who specifically want REIT and energy income are getting a packaged version of that exposure. Others should weigh the risk against the SPYD/SPHD baseline before reaching for the higher number.
Internationally, IDV is the cleaner trade. A 4.45% yield from large, established non-U.S. companies, a 0.50% expense ratio, and—as the 51.69% calendar-2025 return demonstrated—a meaningful currency tailwind when the dollar is in a weak phase.
SDIV’s 8.42% yield is the highest in the comparison and the most precarious. With roughly half of the recent distribution classified as a return of capital, the headline number does not reflect what most investors will realize as long-term total return. For an investor who specifically wants global high-yield equity income and understands the trade-offs, it can have a place at the margin. As a primary income holding, it is hard to defend.
The reward from dividend income depends entirely on how much risk the yield is actually compensating you for—and on whether the distribution is funded by earnings or by your own principal. In 2026, the cleanest answer for most investors is the cheapest one.