 Tableau Software might be the biggest big data company you’ve never heard of. The lovechild of a Pixar founder and a Stanford University-Department of Defense project, the 10-year-old Seattle-based company applies the computational tools of the gaming and movie industries to presenting business analytics in beautiful, accessible graphic images. Now worth more than $6 billion in market capitalization, Tableau competes with the likes of Oracle and IBM, serves a hefty share of Fortune 500s, and nearly doubled sales in 2013, the year it went public.
In 2003, “people were struggling with increasing amounts and sources of data,” says Tableau chief marketing officer Elissa Fink. It led Stanford computer scientist and electrical engineer Pat Hanrahan, a founding member of Pixar, to ask, “We have so much computing power. Why is all of that used for great gaming and great movies?” He joined Stanford-trained data visualization expert Chris Stolte and data-analyst-turned-venture-capitalist Christian Chabot to apply it to business data. Making data easy to see and understand, Chabot says, is “one of the great opportunities of our time.”
Today, Tableau’s client accounts top 17,000 , including Facebook, Apple, The Dallas Cowboys, Boeing, Tesla, Exxon Mobil, the U.S. Army, the Federal Aviation Administration, Williams-Sonoma, and Siemens, which use Tableau to consume, edit, and share data across employees and departments. The software translates data in all its forms into visually compelling formats.
Facebook is using the software to let employees analyze data compiled from its billion-plus users. Nearly 70 percent of Rosetta Stone’s financial team is using Tableau to process hundreds of thousands of client interactions Federal contractors use it to streamline and make data more usable for government employees. For instance, ASM Research saved the U.S. Army $20 million in data processing costs using Tableau, according to Chabot in an October conference call with investors.
But small companies and even individuals use Tableau too. Fink described how a small French karaoke restaurant chain uses the software to track its growth.
In May 2013, Tableau‘s IPO raised $254.2 million, placing it among the top offerings of the year. Within a month, the company had joined the Russell 3000 index of the 3,000 largest U.S. companies. Tableau’s share price has risen more than 97 percent through Friday to more than $100, up from $50.75 on its first day of trading.
In its last quarterly earnings statement, Tableau reported a 90 percent year-over-year revenue jump to $61.1 million. For the quarter, it closed nearly 180 transactions at $100,000 each, adding to the nearly 300 transactions closed in the first nine months of the year.
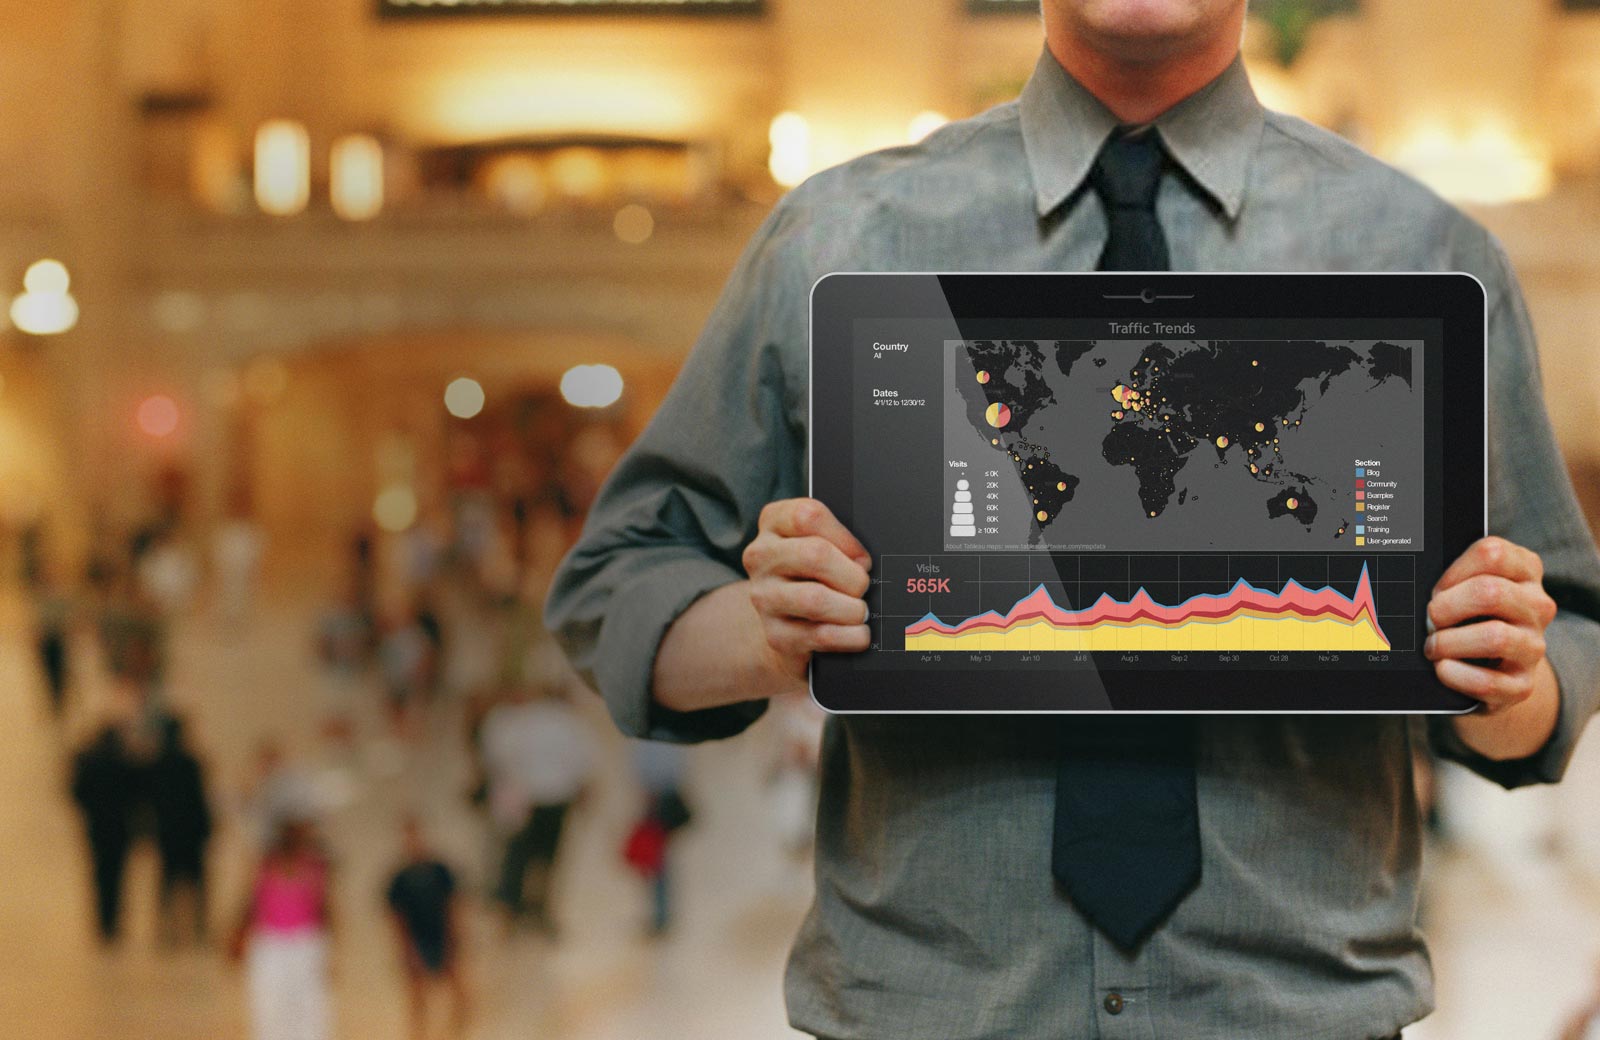
What makes Tableau stand out from other providers of big data analysis? On the company website, Hanrahan explains, “A lot of data visualization research is really about making pretty pictures, but we worked with psychologists and graphic designers to understand how people deal with visual data and process it. We create pictures that answer questions, but we do it for businesses that want to know things about their own metrics.”
Jonathan Pasky, founder of the Data 2.0 conference, calls Tableau’s data visualization tools “the most robust” and says they “have broken down a barrier to allow more people to understand data.”
Business + Innovation
Tableau Applies Gaming Power to Big Data
Tableau Software might be the biggest big data company you’ve never heard of. The lovechild of a Pixar founder and a Stanford University-Department of Defense project, the 10-year-old Seattle-based company applies the computational tools of the gaming and movie industries to presenting business analytics in beautiful, accessible graphic images. Now worth more than $6 billion in market capitalization, Tableau competes with the likes of Oracle and IBM, serves a hefty share of Fortune 500s, and nearly doubled sales in 2013, the year it went public.